Tuesday, February 21, 2012

Production Issue: PostgreSQL 90% CPU Usage

 This blog post is about the production issue which we had last week and it started with the following Alerts.
  1. We use tail_n_mail to monitor all our PostgreSQL server log files and on that particular day tail_n_mail alerted with the following content. "FATAL: too many connections for role "produser" 
  2. We also use Nagios based alerting/graphing both for system(cpu,disk etc) and database(Check_Postgres). On that particular day we also received an email from nagios indicating that the cpu usage have been hovering around 80%
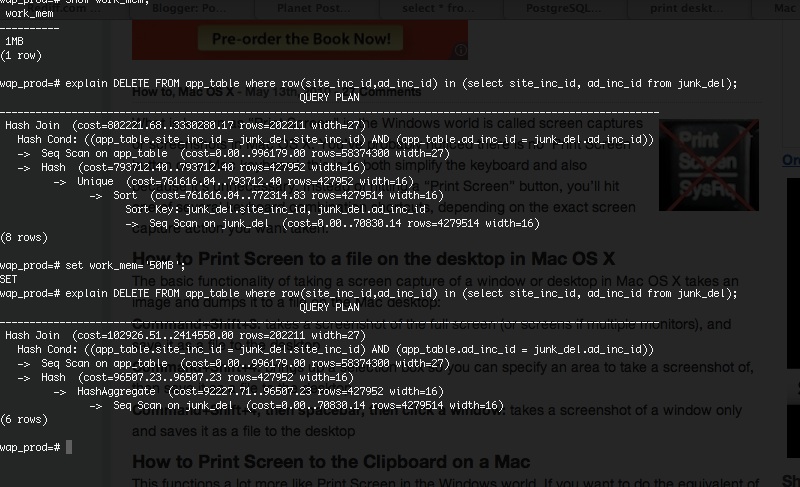
Based on the above alerts we thought that the database had more hits compared to average hits. On logging into database we found more number of queries running for long which seemed unusual because all queries on our production finishes within milliseconds. On running EXPLAIN plan on the query we found the real issue which was a missing index for a new application feature which was just enabled for all customers. So the reasoning of how a missing index triggered the alerts is below.
  1. The number of hits to the database was indeed normal however the queries were taking too long to execute due to missing index
  2. Since the index was missing, the application queries were executing with a Sequential Scan which caused the spike in CPU usage.
  3. On the other hand since queries were taking longer, new requests from application requested the database to allocate more number of connections which eventually led to running out of connection allowed for that particular produser. 
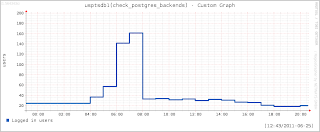
Based on the above reasoning we immediately created a new index on that particular table which caused the alerts to go away and this is clearly visible from the below graphs.


The graphs shows that once the index creation was done the cpu usage reduced to less than 5% and also the number of connections reduced to the older levels of around 20. 

From the above incident we got the below priority items to be fixed:
  1. Use connection pooler so that in future requests will be queued at the pooler rather than being denied for connection.
  2. Enable Nagios alerting for queries running above certain threshold using check_postgres.pl
  3. Evaluate all application queries before pushing it to production.
In short be aware of the fundamentals for database performance like missing indexes else it could create a havoc for database performance.

Sunday, May 29, 2011

Slony and PostgreSQL Partitions

   To start with in our company we had a sales application which reads/writes sales data about US,EU and AU regions in one database. As the number of hits for our application grew our database  had performance issues along with the existing latency issue. Latency issue was due to both application and database being hosted in India(headquarters) and most of our customers were is United States, Australia and Europe. We took this opportunity to distribute our application globally and re-architected our application as shown in the diagram below:


Basically we hosted multiple instances of our application and databases as per our customer proximity. So for US customers we hosted a instance of our application and database in US data center and similarly for EU customers in EU data center and AU customers in AU data center.  This helped us improving performance and latency as well. Also as a side effect of this architecture when any disaster happens only that corresponding region was affected and the rest was operating without any issues.
  Next we wanted to consolidate the sales data of all our regions to global headquarters where accounting and settlement were happening. To achieve this we availed the services of Slony Replication and PostgreSQL Partitioning. On our head quarters database we created sales table as the master table and sales_us, sales_eu and sales_au were inherited from master table. Moreover sales_us, sales_eu and sales_au tables were all replicated from their respective regions to headquarters using Slony Replication.This helped us in consolidating all the sales data to headquarters which were then exposed via the Global Sales App.
  In short we showcased to our Management how we emulated MultiMaster Replication with Slony by completely avoiding conflict resolution cases with help of individual tables and Table Inheritance.
 For reference the cluster creation code can be found at Cluster Creation Code

Tuesday, April 12, 2011

Load Balancing for PostgreSQL Database

     As explained in this post we achieved Read Scalability with Slony for our PostgreSQL databases. The next task was to achieve Load Balancing and some level of High Availability for our databases within each Data Center for all known reasons. This blog gives an overview of how we achieved the same.

Before Load Balancing


        As shown in the diagram above our web application had one to one correspondence to the database. Also for each client request the App Node used to hit the database with a short and stateless transaction request. On an average each Database Node was performing around 3000 TPS and in order to avoid each request creating a new connection we used pgbouncer as our connection pooler. This setup was working well to begin with before we started facing the following issues.

  • Requests to App Node was random in nature and as a result DB Node was having random load issues
  • Overall DB Nodes usage was very less which forced us to answer tough questions during expansion
  • During maintenance of DB Node, the corresponding App Node had to be out of live traffic due to one to one correspondence
  • Whenever a DB Node goes down, we had a dilemma of whether an existing live node can take additional traffic before we hit on capacity
After Load Balancing

       After little bit of research and checking our hardware inventory we moved to the below architecture which solved most of the above issues.

   As shown above we introduced a Load Balancer in between the App Nodes and DB Nodes. Now all incoming DB requests will be intercepted by the Load Balancer and will be forwarded to the appropriate DB Node based on configuration like round-robin, least connections etc. This helped us in achieving Load Balancing of the DB requests.
  The other interesting snippet in the above image is the "Health Check" component. The "Health Check" component has multiple checks on PgBouncer and PostgreSQL database to determine if it is healthy and can take live traffic. The Load Balancer runs these checks periodically on the background and marks whether a DB Node is UP or DOWN. For each incoming request, LB redirects the request to the appropriate DB Node which is UP and thereby avoiding the node which is marked as DOWN. This has helped in achieving partial level of High Availability for applications. One case where it fails is if all the DB Nodes are marked as DOWN.
   In summary by adding a Load Balancer and introducing "Health Checks" we achieved Load Balancing and partial level of High Availability.  More specifics about the implementation is reserved for another blog post which will follow in sometime soon.


Sunday, March 13, 2011

What is my index creation doing?


As part of our new application release based on the row selectivity estimates and for performance reasons we decided to create an index on table named test. The table in discussion had 36 million rows and the size was around 7GB. One of my colleague started the index creation process with the following command.
"create index indx_test on test(advertiser_id);"


On firing the command the screen looked like as though the command was running. It was running for more than 20 minutes and my colleague had no idea when the index creation is going to finish because PostgreSQL doesn't print any progress messages. Now my colleague's manager posted a question to him. Is the index creation runnning and what exactly it's doing? For the first part of the question my colleague figured an answer by running
 "select * from pg_stat_activity where current_query ilike 'create index %'"
and the command was indeed running because the column waiting was equal to false.

Puzzled about the second part of the question my colleague called me for help. Since PostgreSQL doesn't print progress messages we decided to use strace for our rescue. On stracing(strace -p 21060) the process we found the process was doing a lot of read and write calls. On closer look at the arguments for read and write system calls we found the File Descriptors the process was using. To be more precise
the numbers were 17(read call) and 21(write call).


The backend pid of the job was 21060 and we changed our directory to /proc/21060/fd. On executing ls -l on 17 and 21 the output pointed us to relfilenode(498021.4) and a temporary file it was creating for index. On looking at the entry in pg_class for the same refilenode we ended with table named test. Actually the command was reading the 5th GB of the 7GB files since the table was around 7GB in size. In postgresql based on the way you compile the server a new file is created for each additinal GB for the
same table/index with same relfilenode with .1,.2 as extensions. For more details refer to http://www.postgresql.org/docs/8.3/static/storage-file-layout.html

Armed with the above knowledge my colleague informed his manager that index creation would finish approximately in another 20 - 25 minutes since initially it took 20 minutes to read 4GB of the file from the start(1GB = 5mins) and approximately it still needs to read another 4GB( 7GB(table size) + 1GB temporary file + creation of new index file = 45 minutes approx.) . The above timings are all rough estimates.
The system in discussion had low IO throughput because 5 minutes for reading 1GB of file is really on the higher side. I also suggested my colleague to look whats happening with the IO on the system.
   Long story short strace along with File Descriptors and relfilenode revealed what index creation process was exactly doing.


Thursday, February 24, 2011

quick work_mem trick

One of my friend ended up with 4 million additional junk rows in a table due to an application bug. The table originally had around 54 million rows. Since the table was an important one, my friend asked me to delete those junk rows from the table as soon as possible with the following constraints.

  • No selective dump and restore because my friend had no exact way of identifying the junk rows
  • Cannot restore from backup because this needs downtime of the application. Moreover the table was in slony replication and this means I need to unsubscribe/subscribe the slony set to multiple slaves.
So my first task was to identify those junk rows. After a quick chat with developers I found that on triggering the application bug once again it created the same 4 million junk rows. Quickly in the staging environment we created a junk_del table with 4 million rows which has to be deleted from the source table named app_table. Now the task was easily solved with the following query.

DELETE FROM app_table WHERE row(site_inc_id,ad_inc_id) IN (SELECT site_inc_id, ad_inc_id FROM junk_del);

Next I wanted to get a rough estimate on the time taken to run the above query. On running EXPLAIN  it  revealed that its going to take 1 hour to execute which looked little bit on the higher side.
Digging around we increased the work_mem from the current default of 1MB to 50MB only for this session and as we expected the time reduced to roughly 40 minutes.

With full joy we executed in production and it finished in just 19 minutes. To summarize increasing work_mem was quick and worthy trick which really helped us. At the end of it my friend was happy for obvious reason.

Friday, February 18, 2011

Read Scalability with PostgreSQL/EnterpriseDB

Read Scalability with Slony and EnterpriseDB/PostgreSQL
   One of the startups which I consult started to grow leaps and bounds which challenged me to achieve Read Scalability. As a general wisdom Read Scalability with PostgreSQL/EnterpriseDB can be achieved through various techniques like partioning, sharding, replication etc. Based on our existing infrastructure, we achieved the scalability through Slony and EnterpriseDB from the current vertically scaled Database Master.
The interesting snippets in our setup is Slony communication across different data centers using private vpn tunnel and also stunnel setup between hosts involved in replication cluster for improved security. Morever since Master and Slaves were in different data centers, communication between them was impossible in few cases due to Network Security requirements thereby forcing us to create multiple clusters for replication. Maintenance with multiple slony clusters becomes little trickier when we have schema changes and unsusbscription/subscription of sets which is reserved for another blog post. The below architecture diagram shows our slony setup in more detail.


Cluster Creation Code
---------------------------------